Annotations
Annotations attach a short text note to any region's native browser tooltip. When a viewer hovers over a country or region in a browser, the OS tooltip shows the annotation alongside the region's value. No JavaScript, no popovers — the text lives in the SVG <title> element. That means it only surfaces when the SVG is loaded as a document (opened directly, or embedded inline or via <object>), not when it is embedded with <img>.
Examples
Two annotated regions — hover in a browser to see the tooltips:
https://api.maproll.io/map.svg?scope=world&theme=dark&data=RO:120,DE:95&annotations=RO:Election+2024,DE:GDP+down+2%25

Annotation-only (no choropleth values) — tooltips provide context without filling regions:
https://api.maproll.io/map.svg?scope=world&theme=dark&annotations=US:Largest+economy,CN:Second+largest,DE:Largest+EU+economy
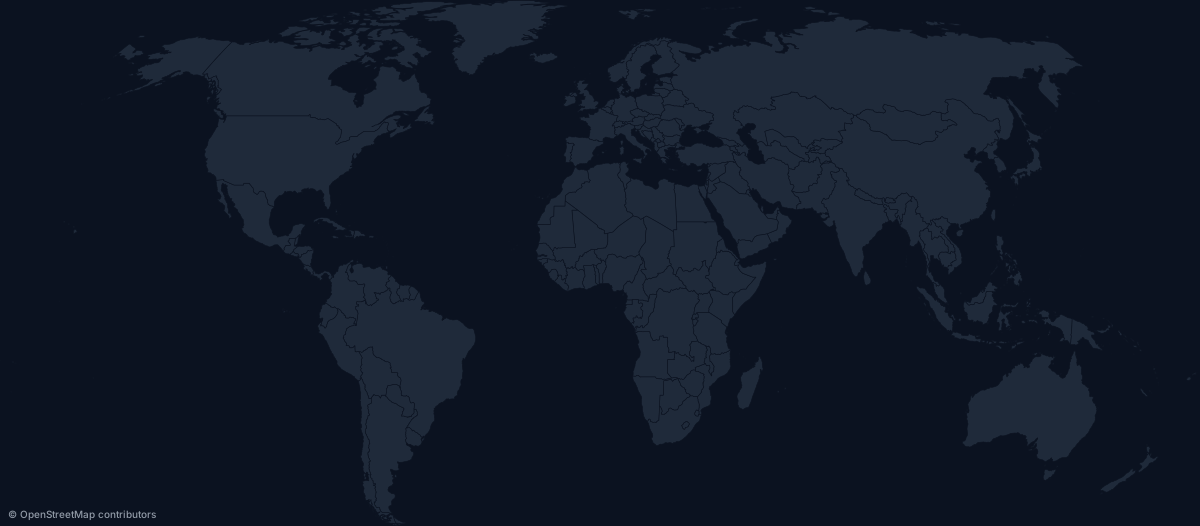
Annotation containing a colon — the parser splits only on the first colon, so timestamps and source citations work:
https://api.maproll.io/map.svg?scope=world&theme=dark&data=RO:120&annotations=RO:Source%3A+WHO+2023

Parameters
| Param | Type | Default | Allowed | Notes |
|---|---|---|---|---|
annotations | string | — | See URL syntax | Comma-separated id:text pairs |
annotation | string | — | Up to 200 chars | Per-region field in the JSON body (regions[].annotation) |
URL syntax
annotations=id:text,id:text,...
The first colon in each entry separates the region id from the text. Subsequent colons are part of the text, so annotations like RO:Source: WHO 2023 work correctly.
URL-encode spaces as + or %20, percent signs as %25, and colons within the text as %3A:
# Basic annotation
annotations=RO:Election+2024

# Multiple regions
annotations=RO:Election+2024,DE:GDP+down+2%25

# Annotation containing a colon
annotations=RO:Source%3A+WHO+2023
JSON body syntax
Annotations are set per-region in the regions array:
{
  "scope": "world",
  "theme": "light",
  "regions": [
    { "id": "DE", "value": 95, "annotation": "G7 member" },
    { "id": "RO", "value": 120, "annotation": "EU member, NATO 2004" }
  ]
}
Tooltip format
The SVG <title> content depends on what is present for the region:
| Region has | Tooltip shows |
|---|---|
| Value + annotation | RO: 120 — Election 2024 |
| Value only | RO: 120 |
| Annotation only (no value) | RO — Source: WHO |
| Neither | RO |
The separator between value and annotation is an em-dash (—). < and & in annotation text are automatically XML-escaped.
Notes
- Native browser tooltips only. The SVG
<title>element surfaces as the OS-native hover label. This is the ceiling for tooltip behavior in static SVG — no custom styling, no popover positioning. - Tooltips do not work inside
<img>tags. An SVG loaded through<img>is rendered as a non-interactive, isolated document in every browser — it receives no hover events, so<title>never surfaces. The examples on this page are embedded that way and will not show tooltips. To get hover behaviour, open the SVG URL directly, or embed it inline or via<object>. - 200-character limit per annotation. Enough for a one-line context note; keeps
<title>from becoming unwieldy in screen-reader output. On the URL path, longer text is rejected with400 invalid_annotations; onPOSTit fails schema validation (String must contain at most 200 character(s)). - Annotations have no effect on the visual render. The map looks identical with or without annotations — they only affect the tooltip text.
- No annotations on markers. Markers have their own
labelfield and derive their tooltip from it. Theannotationsparameter keys on region ids, not marker positions. - No formatting. Plain text only — no bold, italics, or links inside the annotation.
Related
- Region labels — visible text drawn directly on polygons
- Markers — point icons with their own label field
GET /map.{svg,png}— full query parameter reference- POST /render/map — JSON body schema with
regions[].annotation